


PEST Utilities In FePEST
Sensitivity Export (JROW2VEC)
Linear sensitivity indicates how the parameters influence certain observations. This is expressed in terms of derivatives (saved in a Jacobian matrix) that are calculated during the optimization.
The derivatives (also referred to as sensitivities) are a valuable by-product of the optimization and they can be exported for further investigations.
Once the Jacobian matrix is calculated, the sensitivities are ready for export. This is done whenever optimization is performed (i.e. with any mode - parameter estimation or predictive analysis).
If no optimization is done, the NOPTMAX setting in the Termination criterion settings can be set to "Jacobian only" (-1). With this setting, PEST calculates the Jacobian matrix of the first iteration and terminate without making any changes to the initial parameter values.
Further reading: PEST Manual (5th Ed.) section 2.2.9: Termination Criteria.
The “Sensitivities” feature in the “Estimation” menu executes the JROW2VEC utility of PEST. This exports the sensitivities of parameters for the selected observations. Results can be:
-
transferred to a spreadsheet program for further processing (using the “Copy” option)
-
exported to an ASCII table (*.dat) file.
This is done in conjunction with the spatial maps that relate the parameters to their respective zones or pilot point locations. The sensitivity maps can be created in FEFLOW or GIS software.
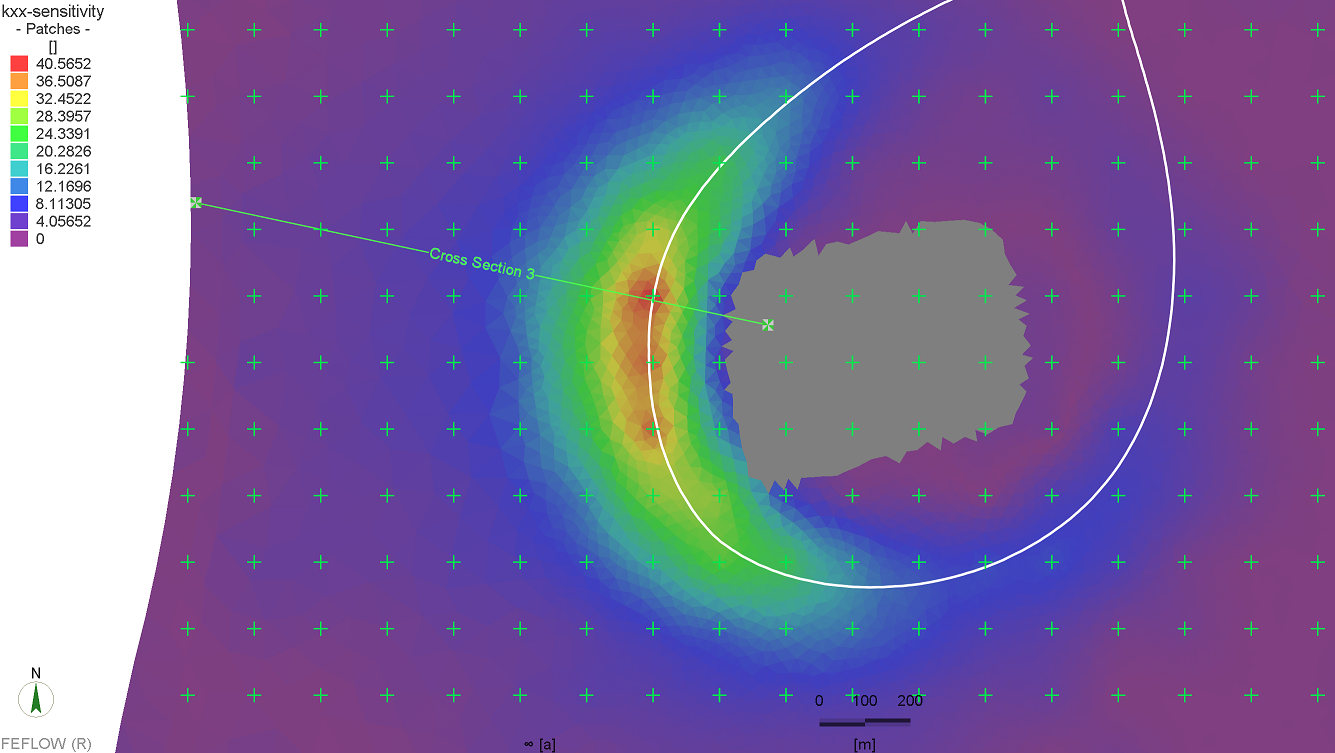
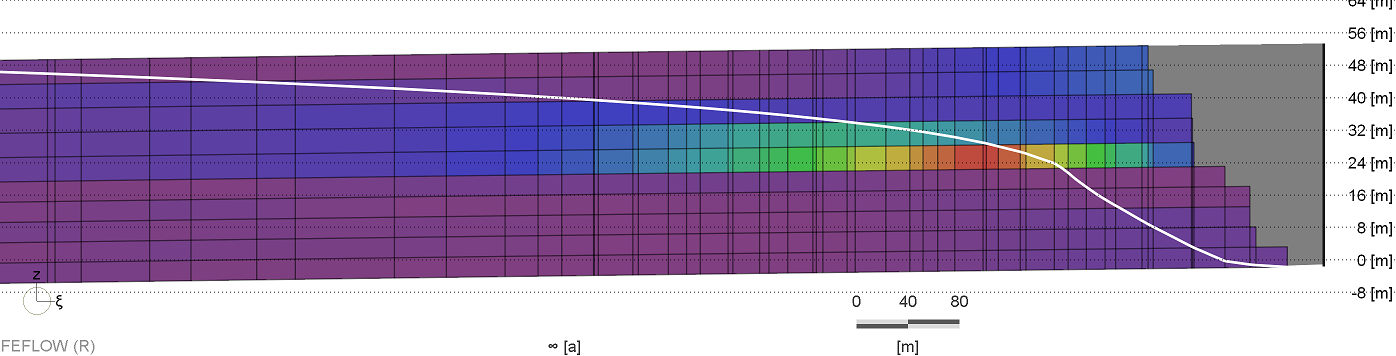
Sensitivity maps (plain view of layer 5 and cross-section of indicated line shown.) of hydraulic conductivity in a 3D model. These are created by spatial interpolation of pilot point parameter sensitivity. White line indicates the water table.
Model Stability Tests (JACTEST)
it is important that the numerical model is stable enough to reproduce observation - parameter relationships.
As a measure of trouble-shooting, PEST provides a tool (JACTEST) to check if the model is running sufficiently stable to calculate the Jacobian matrix. This tool can be activated using FePEST with the “Model Stability” option in the “Estimation” menu.
JACTEST runs the model multiple times with incremented/decremented parameter values for derivative calculation and plots them against the selected model outputs (observations).
Further reading: Addendum to the PEST Manual (5th Ed.) section 3.20: JACTEST
Using JACTEST
If PEST fails to reduce the objective function and is suspended due to bad derivatives, it is recommended to stop PEST (if still running). Open the “Show Results” dialog and “Apply” the latest values as initial parameter values (you may want to save the FPS file now under a different name).
Open the “Model Stability” dialog from the “Estimation” menu. The user is prompted to do the following:
-
Specify the parameters to be tested - only the parameters that are suspected to cause instabilities should be chosen here.
-
Specify the number of iterations to be performed for each parameter. A value of 4 (or greater) should at least identify the cases where parameter–observation relations are random.
After the calculation has finished, the diagram window shows the resulting observation values. Stability of the model is ensured if the slopes are similar (with slight changes). An example for a stable model is shown in figure below.
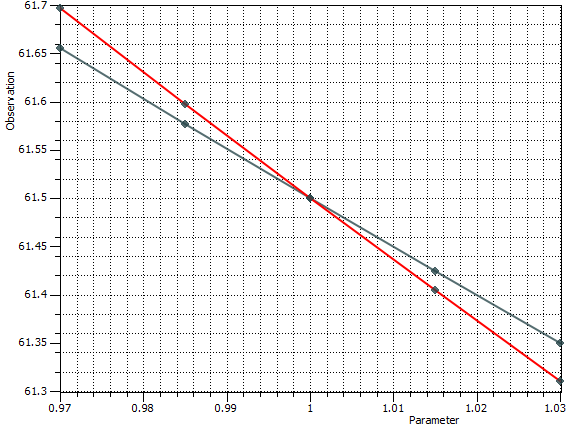
JACTEST result indicating stable model behaviour. Two parameters are incremented / decremented four times each by 1.5 % around the initial value, the resulting values for a particular hydraulic head observation are plotted.
However, if the parameter values change randomly (and significantly), noise dominates the observation. It is the useful to identify the affected parameter–observation combinations, and open and run the model in FEFLOW to find and solve the instability issue.
The model stability calculation will be run by BeoPEST if parallelization has been enabled, in the problem settings.
Linear Analysis (GENLINPRED)
The PEST Utility GENLINPRED stands for general linear predictive uncertainty/error analyser. This utility driver sets different utilities to carry out the assessment of the uncertainty and/or error variance of a parameter or prediction. Some of the tasks undertaken by GENLINPRED utility in FePEST are summarized below:
-
Estimation of the optimal number of dimensions of the calibration solution and null spaces.
-
The parameter identification and relative reduction of the error variance of each parameter. It also computes the relative uncertainty variance reduction of each parameter.
-
Calculation of the solution and null space components of the total error variance of a specific FEFLOW prediction at different levels of singular value truncation. It follows with an evaluation of the number of pre-truncation singular values employed in the calibration of a FEFLOW model.
-
Estimation of the uncertainties for the pre- and post-calibration stages.
-
Contribution to the pre- and post-calibration error variance and/or uncertainty of a nominated prediction (parameter) made by different parameter groups or individual parameters.
-
The worth of different observation groups or different individual observations for lowering the post-calibration error variance and/or uncertainty of a nominated prediction (parameter).
The PEST Utility GENLINPRED is available in FePEST from the menu Estimation - Utilities. GENLINPRED dialog requires certain inputs depending on the specific tasks. Further details of the parameters can be found in the Addendum to the PEST Manual.
After GENLINPRED is run, all the results are available in the Linear Analysis tab in FePEST. For a more comfortable visualization, the PEST result file can be directly opened from FePEST by pressing the button “View”.
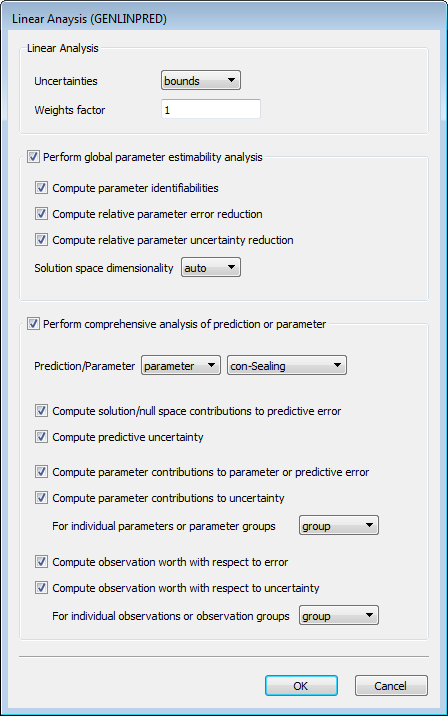
Linear Analysis (GENLINPRED).
Sensitivity Analysis (SENSAN)
Sensitivity analysis of particular model outputs to particular model configurations (i.e. material properties) is a common modelling task. Such a task can also be considered as the initial step before model calibration in order to understand the relevance of the model inputs.
FePEST provides a fast way to estimate sensitivities, relative differences and model outputs from a specific set of model parameters. For this task FePEST uses the PEST Utility SENSAN.
A user-defined parameter list can be imported that can be used to configure several FEFLOW model scenarios. In principle, unlimited number of model runs can be used in SENSAN, but the utility is not parallelized in PEST. Therefore, it is best to chose the maximum number of scenarios such that the computational resources are not exceeded. If the uncertainty of the parameters to the model outputs has to be explored, the Monte Carlo Analysis in FePEST is recommended as it takes advantage of the paralellization capabilities.
Definition of Parameter Variability Sets
The definition of the variability parameter set can be carried out either manually or automatically. The manual addition of model scenarios is included by clicking on the button “New” and then modifying the parameter value in each new row of the parameter variability table. The automatic generation of parameters involves the modification of all active parameter by a specified factor (e.g. 10% of the initial parameter value).
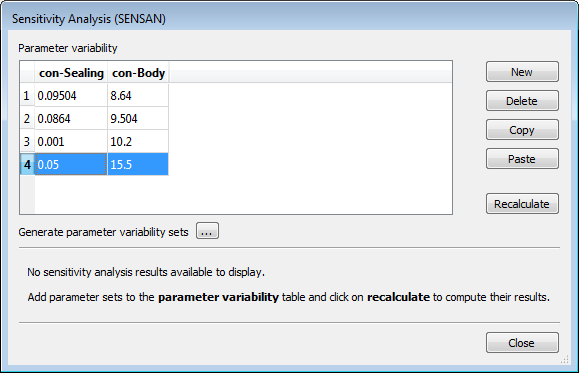
Sensitivity Analysis Utility (SENSAN): Parameter variability set.
Once the parameter variability sets are defined, SENSAN utility is executed by pressing the button “Recalculate”. Immediately, the information about SENSAN run and its progress is available in the Output tab in FePEST.
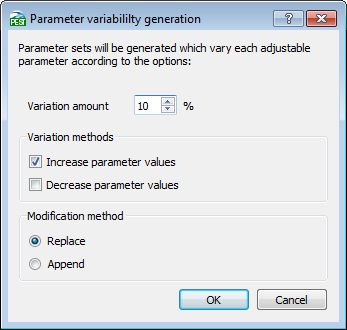
Clicking on the ellipsis (…) button to the right of the Generate parameter variability sets button, displays a dialogue which provides a convenient way of adding sets of parameter variability. Sets of parameters which increase and/or decrease each parameter in turn may be generated by a given percentage may be generated. Be sure to select the Append option to add to the current sets, otherwise they will be replaced.
After SENSAN has finished to run all the FEFLOW model scenarios, a summary table of the results from the multiple runs is available in the Sensitivity Analysis dialog. This table includes three main results:
-
Absolute output: includes the different parameter set and model outputs. The model outputs are the standard observation points (i.e. information of the FEFLOW process variables), rate/period budgets, IFM-implemented observations, etc.
-
Relative differences: contains the estimate of the relative differences (absolute differences) for all the parameter variability sets with respect to the initial parameter value (i.e. problem settings - parameter definitions).
-
Sensitivities: the sensitivities of all the parameter variability sets with respect to the initial parameter value are listed.
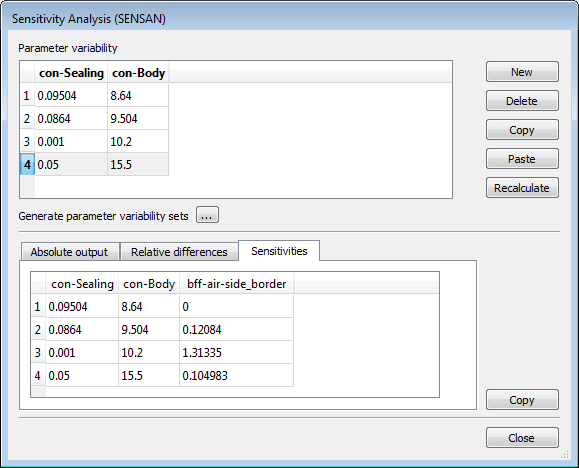
Results of Sensitivity Analysis Utility (SENSAN): Absolute values, relative differences and sensitivities.
All the information available in the different section of the Sensitivity Analysis dialog can be copied entirely to any spreadsheet editor or text editor for further post-processing (if needed).
The sensitivity analysis calculation will be run by BeoPEST if parallelization has been enabled, in the problem settings.