


Introduction to Pareto Mode
When an objective is comprised of two or more goals it is often impossible to minimize all of these simultaneously. Instead, one must be minimized at the cost of raising another. A modeller may then seek a trade-off between different objectives in finding an overall solution at which the model is deemed to be “calibrated”. Alternatively he/she may wish to learn more about the nature of the trade-off between the objectives, thereby acquiring some insight into the information content of the data, and/or into model structural inadequacies.
PEST contains functionality for exploring such trade-offs is by implementing these objectives as objective functions and through its Pareto Mode. During the run, PEST attempts to vary these trade-offs while maintaining a user specified total objective function. The combinations of objective function values calculated by PEST are recorded and maybe depicted graphically as the Pareto Front curve. There are no possible combinations of objective functions values that lie under the curve. The curve itself represents the best possible combinations.
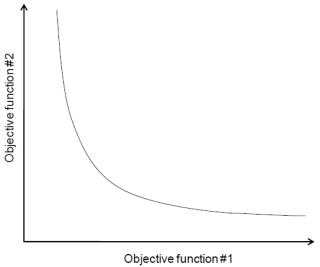
Diagram of the Pareto Front.
PEST can use Pareto Mode in ways, to either examine predictive uncertainty or, when running in regularization mode, the trade-off between the measurement and regularization objectives.
FePEST makes this feature of PEST easier to use by providing the user with a user interface for entering Pareto Mode configurations and displays the results as a table and the Pareto Front curve in a diagram.