


Particle Tracking Workflow
Particle tracking in combination with isochrone markers or period sections can be used to evaluate the flow paths and flow times.
Particle tracking is included in FEFLOW as a visualization option for the active view window. Showing the traces of particles is done in the following steps:
|
|
Field-line visualization is only possible when a calculated fluid-flux field (Darcy velocities) is available. This is the case while running the simulation, when the simulation is paused, and in case a full results file (*.dac) is loaded. |

Define the Starting Location (s)
Starting locations for field lines can be defined
as points or lines. Starting points can be derived from Domain
Locations or Stored Node Selections
in the  Selections
panel. Alternatively, the Current Node
Selection in the Selections
panel can be used. Select seed nodes...
and Draw seed line/points... in
the context menu of the Streamlines
and Pathlines entries in the Data
panel provide quick access to the selection and drawing tools.
Selections
panel. Alternatively, the Current Node
Selection in the Selections
panel can be used. Select seed nodes...
and Draw seed line/points... in
the context menu of the Streamlines
and Pathlines entries in the Data
panel provide quick access to the selection and drawing tools.
Domain Locations can be created by using one of the following options:
-
Using the tools in the Drawing toolbar
-
Converting maps into location sets via the context menu of corresponding maps in the
Maps
panel -
Using Import location Set in the context menu in the
Entities panel.
The following table shows examples for starting locations:
Node selection
3D Polyline
3D Loop
3D Point Group

|
|
Domain Locations may be given customized names by choosing Rename or Edit from their context menu. |

Select the Domain
Location to be used as starting location (s) for streamline visualization
by clicking on it in the Entities
panel.
Choose the Type of Field Lines
Four types of field lines are listed in the Process Variables > Fluid
flow section of the Data
panel:
-
Streamlines: Forward or Backward
-
Pathlines: Forward or Backward
Choose the type of field lines to be visualized
by double-clicking the corresponding entry in the
Data panel.
Add the Traces to the View
With the double click on the parameter in the
Data
panel the field lines are calculated and added to the
View Components panel. The traces
are drawn in the active view if the checkmark in front of Traces
is set in the
View Components panel.
Period Sections
and Isochrone Markers can be shown
by checking the corresponding check box in the tree of the
View Components panel.
When Current Selection is used as the starting point geometry, additional nodes may be selected after making the traces visible. Thus, streamlines/pathlines can be added interactively.
|
|
Which FEFLOW parameter should be used
as effective porosity for the streamline/pathline computation
can be defined in the Problem
Settings dialog. The option Edit
Field-Line Computation Settings in the context menu of
the Streamlines/Pathlines,
Forward, and Backward
entries in the |
Edit the Field-line Properties
Options for the streamline/pathline display such as colouring, number of streamlines/pathlines, radius for multiple streamlines/pathlines, etc. are defined as visualization properties.
A double click on the Travel
time group entry in the View
Components panel or on Properties
in its context menu brings the Properties
panel to front, allowing the following settings:
-
Selection of the color scheme,
-
Definition of minimum or maximum flow time, limiting pathline length and influencing the colouring,
-
Selection of the seed time for pathlines,
-
Selection of the number of seeds,
-
Enabling flux-weighted or equally spaced starting distribution,
-
Definition of the starting radius around the starting location.
The changes are applied by pressing the  Apply button.
|
|
The starting radius around the starting points is defined in the x-y plane and is not bound to a slice. Thus, although working in the Slice view some particles might start in a layer located above or below the current slice. If the material properties in adjacent layers differ significantly, quite different field lines may result depending on which layer the tracking starts in. |
Choose Visualization Style
The field lines feature three visualization options
in the View
Components panel: Traces,
Period Sections, and Isochrone
Markers:
-
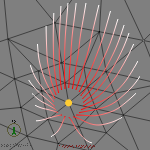
Traces visualize the particle trajectories with a continuous colouring representing the travel time.
-
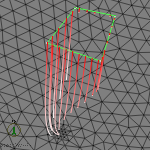
Period Sections provide a view of the trajectories in sections defined by intervals of travel time.
-
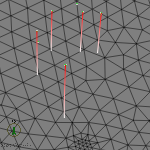
Isochrone Markers can be used to mark locations along the trajectories representing a specific travel time.
The Properties
panel for the different visualization options is brought up front by double-clicking
one of the options in the View
Components panel or via its context menu. It provides the following
options:
|
Traces |
Size, Legend |
|
Period Sections |
Size, Iso (travel time intervals), Legend |
|
Isochrone Markers |
Size, Iso (travel time stages), Legend, Light |